Dec 08 2010

Windows Blue Screen Analysis

Published by under Windows

Despite what you may hear from Microsoft defenders, blue screens still occur in Windows family servers. After the system crash – hence the blue screen – Windows generates a memory dump file in C:/Windows/Minidump. The filename provides the date and time, a useful piece of information that lets you know about the crash frequency. These minidumps are also useful to conduct some Windows blue screen analysis.
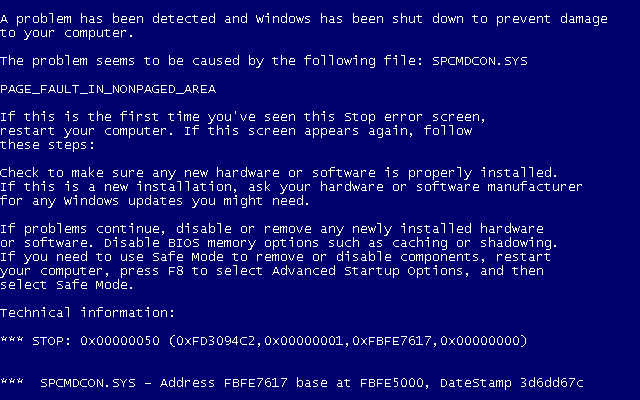
Blue screen analysis


Enable Blue Screen Minidumps

Minidumps should be enabled by default on your system but it is worth checking if you experience blue screens and C:/Windows/Minidump remains empty.
From the control panel:

– Go in System
– Click on “Advanced” tab
– Start and Recovery -> Settings
– Enable “Write an event to the system log”
– Disable Automatically restart
– Select the following debug info:
* Small memory dump (64 Kb)
* Small Dump Directory : %SystemRoot%\Minidump

 
Confirm settings on every window and restart the server.
 

Reproduce Windows Crash

Do whatever it takes to make Windows crash. If you do not know how to reproduce, blue screen dumps will add up in the minidump folder overtime and you can analyse them anytime later on.
 

Install Debugging Tools for Windows

The “Windows debugging tools” provides utilities for dump analysis. You can download them on Microsoft website.
 

MiniDumps Analysis

Now, you will need to extract information out of the minidump file. kd is the command we will use from the debugging tools for Windows to analyse blue screen dumps.

Open a command prompt window (Start -> Run -> “cmd”)

cd \program files\debugging tools
rem (Or the chosen path when you installed the Windows debugging tools)
kd -z C:\WINDOWS\Minidump\Mini???????-??.dmp
kd> .logopen c:\debuglog.txt
kd> .sympath srv*c:\symbols*http://msdl.microsoft.com/download/symbols
kd> .reload;!analyze -v;r;kv;lmnt;.logclose;q

 
You now have a debuglog.txt file in c:\, which you can open with Notepad or any text editor.
 

Conclusion

If you’re lucky enough, you may find the the program or driver name causing the blue screens in the MODULE_NAME and IMAGE_NAME modules. Knowing this, you can now fix the problem.


No responses yet

Oct 28 2010

How to Extend a Windows Partition

Published by under Windows

Extend a Windows volume in command line is pretty easy on Windows with the Diskpart utility. It is available on all Windows flavours. It needs to be done everytime a partition is extended on a SAN for example.
Note that this works for secondary partitions, you need a special tool to extend the C: drive.

C:\Documents and Settings\Administrateur>diskpart

Microsoft DiskPart version 5.2.3790.3959
Copyright (C) 1999-2001 Microsoft Corporation.
On computer: RADON

DISKPART> select volume Y

Volume 5 is the selected volume.

DISKPART> extend

DiskPart successfully extended the volume.

DISKPART> exit

Leaving DiskPart...
 

No responses yet

Oct 05 2010

Force HTTPS Redirect in Apache

Published by under Apache

Configure Apache to redirect HTTP requests to HTTPS protocol. This can be achieved with mod_rewrite.

LoadModule rewrite_module modules/mod_rewrite.so

RewriteEngine on
# Activates Rewrite log
RewriteLog "C:\Apache\logs\rewrite.log"
RewriteLogLevel 1

RewriteCond %{HTTPS} off
RewriteRule ^/(.*) https://%{SERVER_NAME}/$1 [R,L]


RewriteCond %{HTTPS} off filters incoming requests which protocol isn’t HTTPS.


No responses yet

Oct 01 2010

Troubleshoot and Monitor Traffic on Cisco PIX/ASA

Published by under Cisco

You are experiencing extremely slow response times, bandwidth is flat-lining or unusually high, or download speeds are close to 0? Here you will find how to troubleshoot and monitor traffic going through a Cisco ASA or PIX firewall with the command line.
 

Access Lists Statistics

You’ve most likely configured some access lists to filter the traffic going through the device. This is what firewalls do. You can get a quick overview of what kind of traffic is coming through your firewall with ACL statistics.
You can add more rules to narrow down where the traffic is going.

cisco_pix# show access-list acl_in
access-list acl_in; 17 elements
access-list acl_in line 1 permit tcp any any eq domain (hitcnt=7)
access-list acl_in line 2 permit udp any any eq domain (hitcnt=40379)
access-list acl_in line 3 permit tcp any any eq www (hitcnt=157103)
access-list acl_in line 4 permit tcp any any eq 8080 (hitcnt=466)
access-list acl_in line 5 permit tcp any any eq https (hitcnt=1910)
access-list acl_in line 6 permit tcp any any eq ftp (hitcnt=2)
access-list acl_in line 7 permit tcp any any eq smtp (hitcnt=550)
access-list acl_in line 8 permit tcp any any eq pop3 (hitcnt=14660)

 
Reset hit counters in configuration mode to get the latest statistics:

cisco_pix# configure terminal
cisco_pix(config)# clear access-list acl_in counters


Traffic Statistics

You can also display each PIX interface global traffic. You’re better off resetting data to get accurate results.

cisco_pix# clear traffic

 
Give it a few minutes to collect the data and display the overall traffic.

cisco_pix# show traffic
outside:
        received (in 9.570 secs):
                133 packets     19918 bytes
                13 pkts/sec     2081 bytes/sec
        transmitted (in 9.570 secs):
                199 packets     22997 bytes
                20 pkts/sec     2403 bytes/sec
inside:
        received (in 9.570 secs):
                158 packets     14392 bytes
                16 pkts/sec     1503 bytes/sec
        transmitted (in 9.570 secs):
                102 packets     14264 bytes
                10 pkts/sec     1490 bytes/sec


Monitor the Type of Traffic

You can also display the number of connections per second for each type of traffic, from transport to application layers.

cisco_pix# show perfmon

PERFMON STATS:    Current      Average
Xlates               0/s          0/s
Connections          0/s          0/s
TCP Conns            0/s          0/s
UDP Conns            0/s          0/s
URL Access           0/s          0/s
URL Server Req       0/s          0/s
TCP Fixup           27/s          1/s
TCPIntercept         0/s          0/s
HTTP Fixup           5/s          2/s
FTP Fixup            0/s          0/s
AAA Authen           0/s          0/s
AAA Author           0/s          0/s
AAA Account          0/s          0/s


Sessions Details

Display the current and maximum number of connections:

cisco_pix# show connections count
35 in use, 195 most used

 
Or going deeper into details with each established connection:

cisco_pix# show connections
33 in use, 195 most used
TCP out 172.18.0.1:23 in 192.168.9.101:1155 idle 0:00:32 Bytes 19354 flags UIO
TCP out 172.18.0.1:23 in 192.168.9.107:1151 idle 0:03:49 Bytes 156840 flags UIO
...

 
Useful since it shows the amount of tranfered bytes for each connection.
 

Memory and Processor

Pay attention to your memory and CPU resources indeed. Entry level Cisco firewalls aren’t equipped with a lot of memory.

cisco_pix# show cpu usage
CPU utilization for 5 seconds = 2%; 1 minute: 2%; 5 minutes: 6%

cisco_pix$ show memory
Free memory:         5069344 bytes
Used memory:        11707872 bytes
-------------     ----------------
Total memory:       16777216 bytes


Ongoing Traffic Monitoring

Many tools are available out there to monitor traffic on Cisco ASA / PIX. You can detect something is wrong only if you can compare with previous data. Graphs are the best way to achieve this.
Among the most popular tools, I’ve retained Cacti, MRTG as well as Smokeping. Smokeping lets you graph and check links latency.

You can get more information on this online on Cisco documentation.


No responses yet

Aug 16 2010

GLPI Ticket User Group Auto Assignment

Published by under GLPI

GLPI user has to select the group he belongs to when creating a ticket or else the field remains empty.
This stored procedure automatically assigns all tickets to the user’s group. Setup a cron job on your Mysql server to run it as often as you need.
 

begin
update GLPI_database.glpi_tracking t
set t.fk_group= (
SELECT g.id
   FROM GLPI_database.glpi_users u,
        GLPI_database.glpi_groups g,
        GLPI_database.glpi_users_groups ug
   WHERE u.id = ug.fk_users
   AND g.id = ug.fk_groups
   AND u.id=t.author
   LIMIT 0 , 1)
where t.fk_group is null or t.fk_group='' or t.FK_group=0;
end


Also check out how to do a full hardware inventory of your network with GLPI.


No responses yet

« Prev - Next »